I recently completed a Positive Psychology course through the University of Pennsylvania and was fascinated by some of the concepts taught by Johannes Eichstaedt around Big Data Psychology and its relationship to social media.
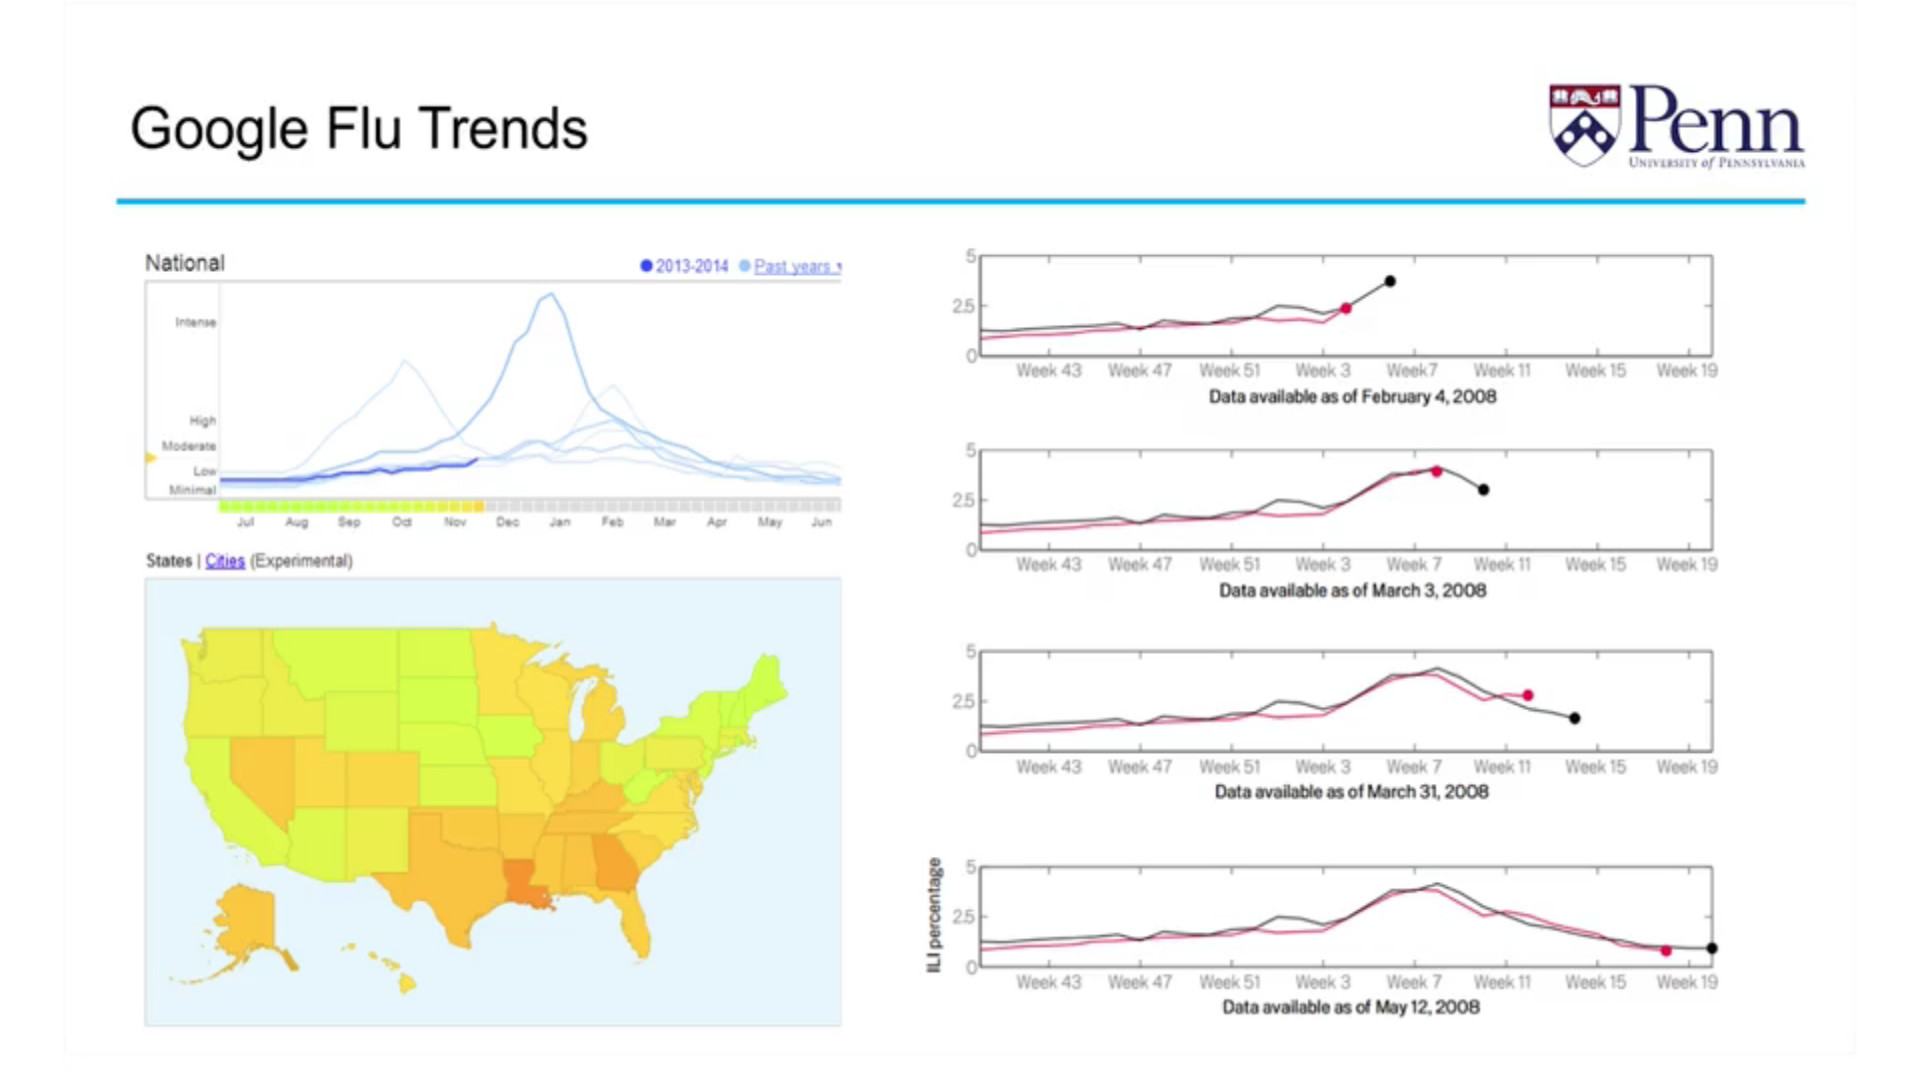
In 2009, Google released a study that that showed that just by measuring the occurrence of search queries related to the flu, they could deduce how the flu was spreading through the United States. They created a map and a time series that showed how the flu was developing across the country through the seasons. Google’s estimates (represented by the black dot) is about two weeks ahead of the estimates from the leading medical authorities in the US about the incidents of flu and tracked at around 98% accuracy to the actual numbers. This became the proof of concept that the internet and data flows could predict people’s behaviors. Google realized that they no longer needed to check reports from the Centers for Disease Control and could now just observe data flows in order to capture the same information.
The Big Question. How Can Big Data Social Psychology Be Applied to Human Behavior?
Typically, psychology studies include 50 to 1000 subjects. With social media, suddenly there is access to billions of people when you consider users of Facebook, Twitter, and the like. A huge opportunity from a scaling and statistics standpoint. The other tremendous opportunity for social media listening is that people behave in different ways when they are not being actively “observed”. That is to say, they will act more “freely” in their own environment and when left to their own devices. In addition, people only function within the spheres of “knowing what they know” and if asked a typical survey question, will respond in order to deliver a contrived notion of who they think they are or provide you with responses they think you would like to hear. Observing “natural” behaviors on social media is the “cleanest” way to capture the “meaning between the lines” and understanding people at a deeper level.
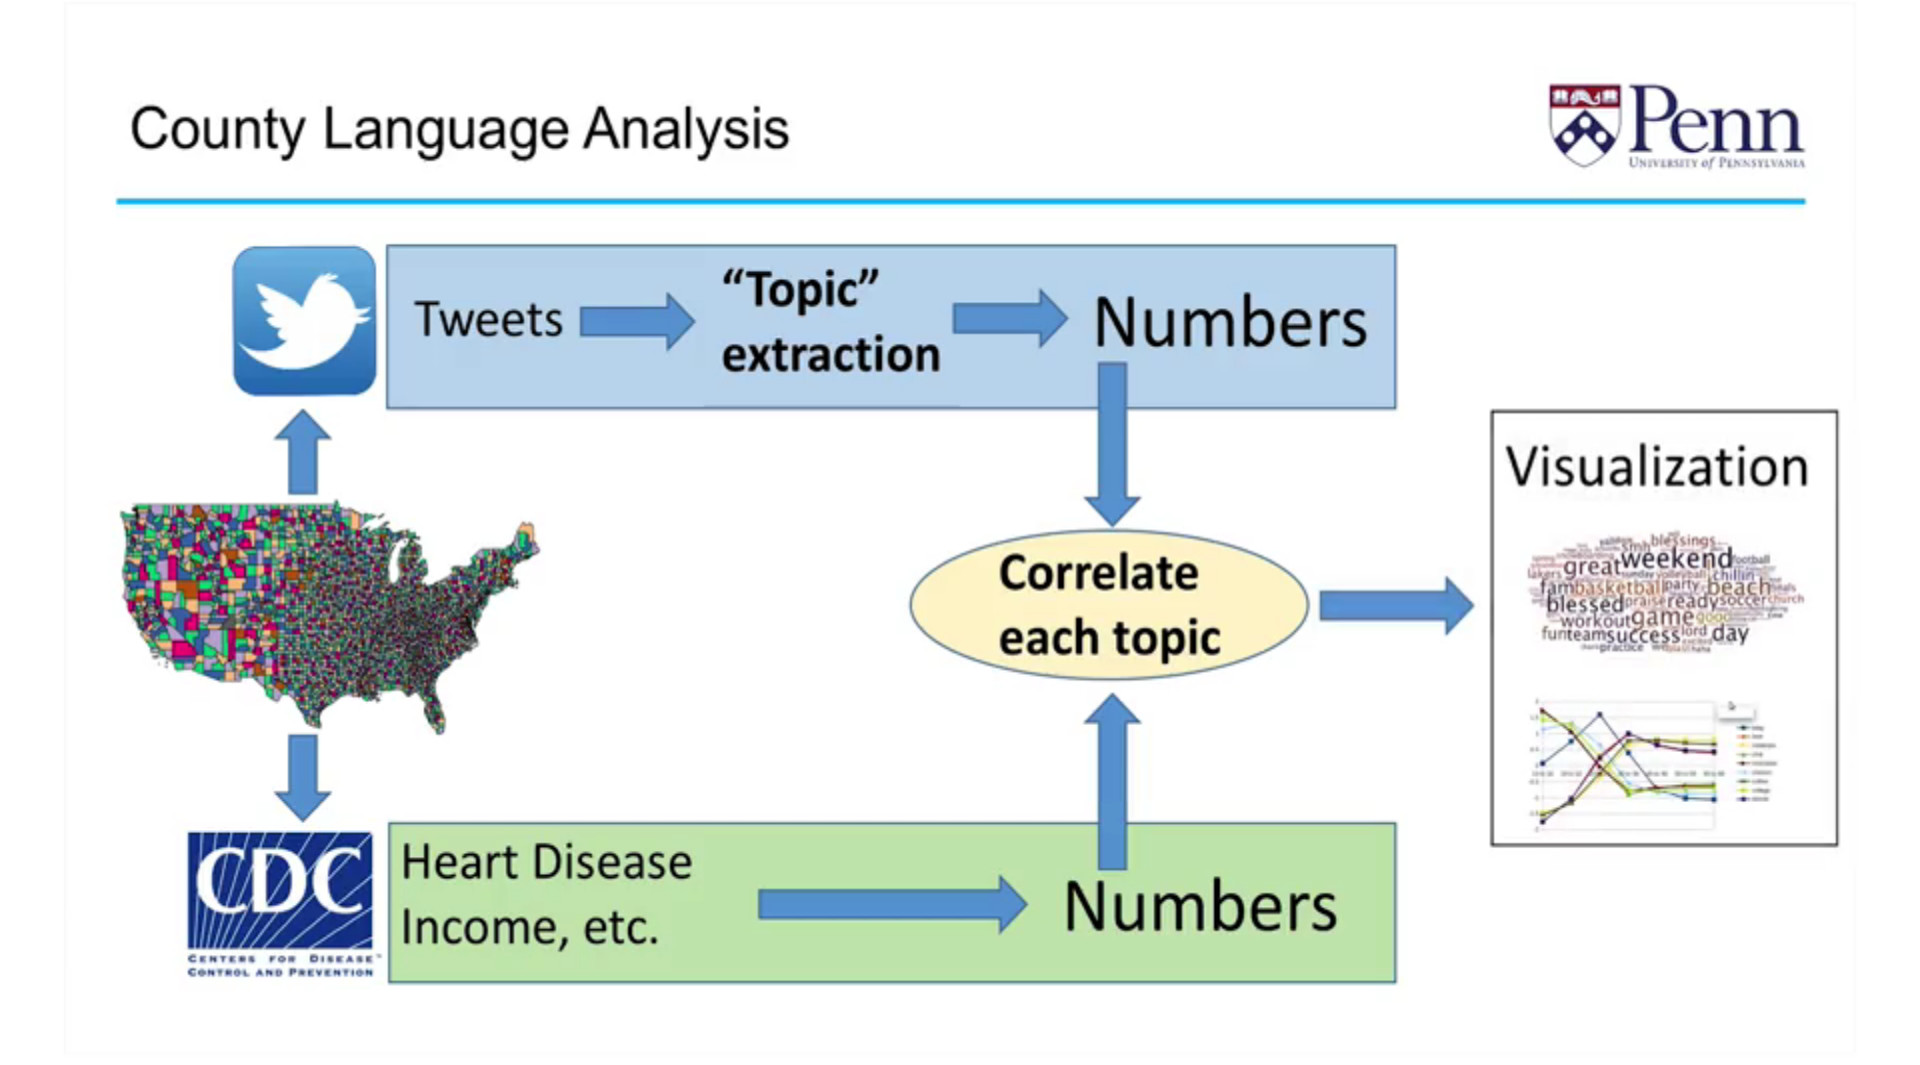
When analyzing the “words” used by people on Facebook through their status updates, the researchers at the University of Pennsylvania were able to count the number of times a specific word was used by a population of people and then determined the percentage of times that specific word was used by those individuals. Each “word” then became a “frequency” statistic. By linking specific words and connecting them to specific personal statistics such as age, gender, and geography, correlations were then made. They were able to tease out words that showed the strongest statistical correlation to the outcomes they were questioning.
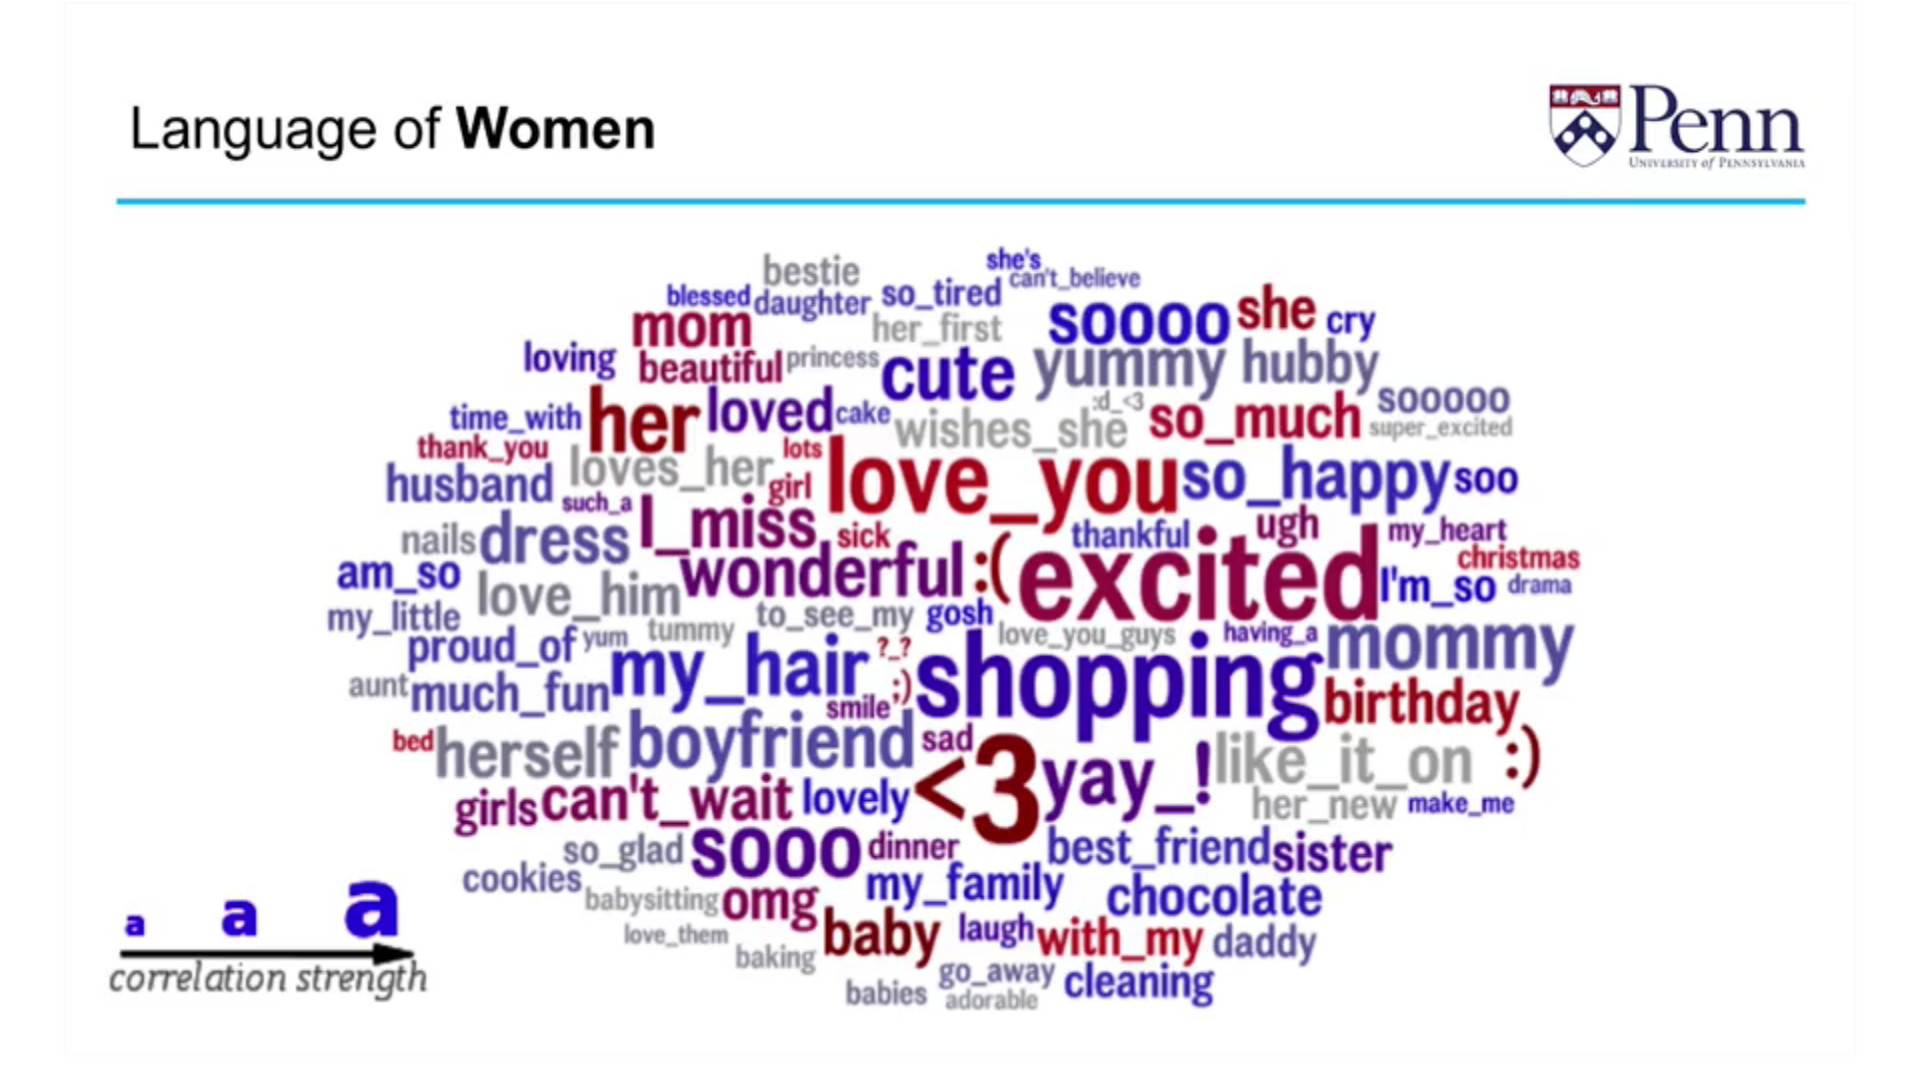
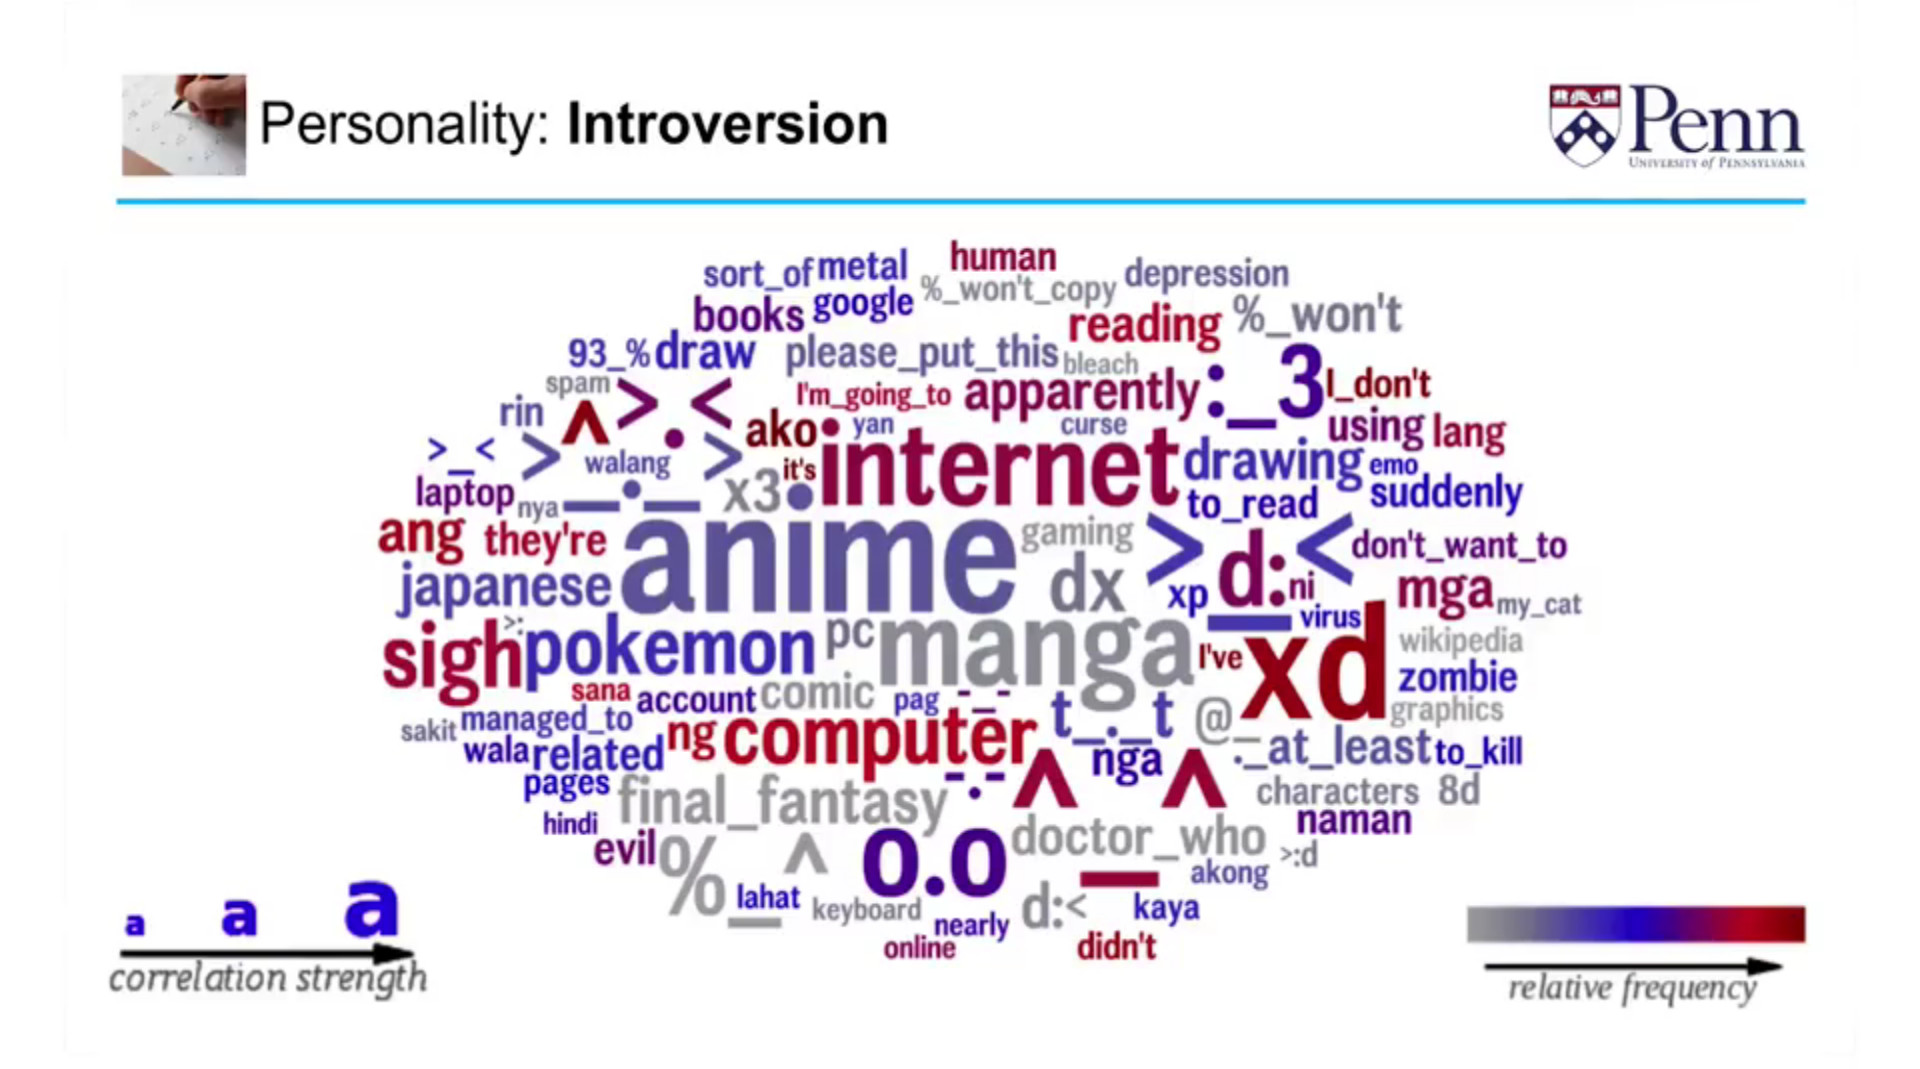
Word clouds were created to help people visualize those correlations. The size of the word encoded the “strength” of the correlation, in other words, the number of times the word was used. The color encoded the “frequency” or the number of times that a word was used. By observing the following “word cloud” one can see that the >3 (heart character) is the single most predictive feature of being “female” on Facebook. It is highly predictive because it’s both large and it is used frequently.
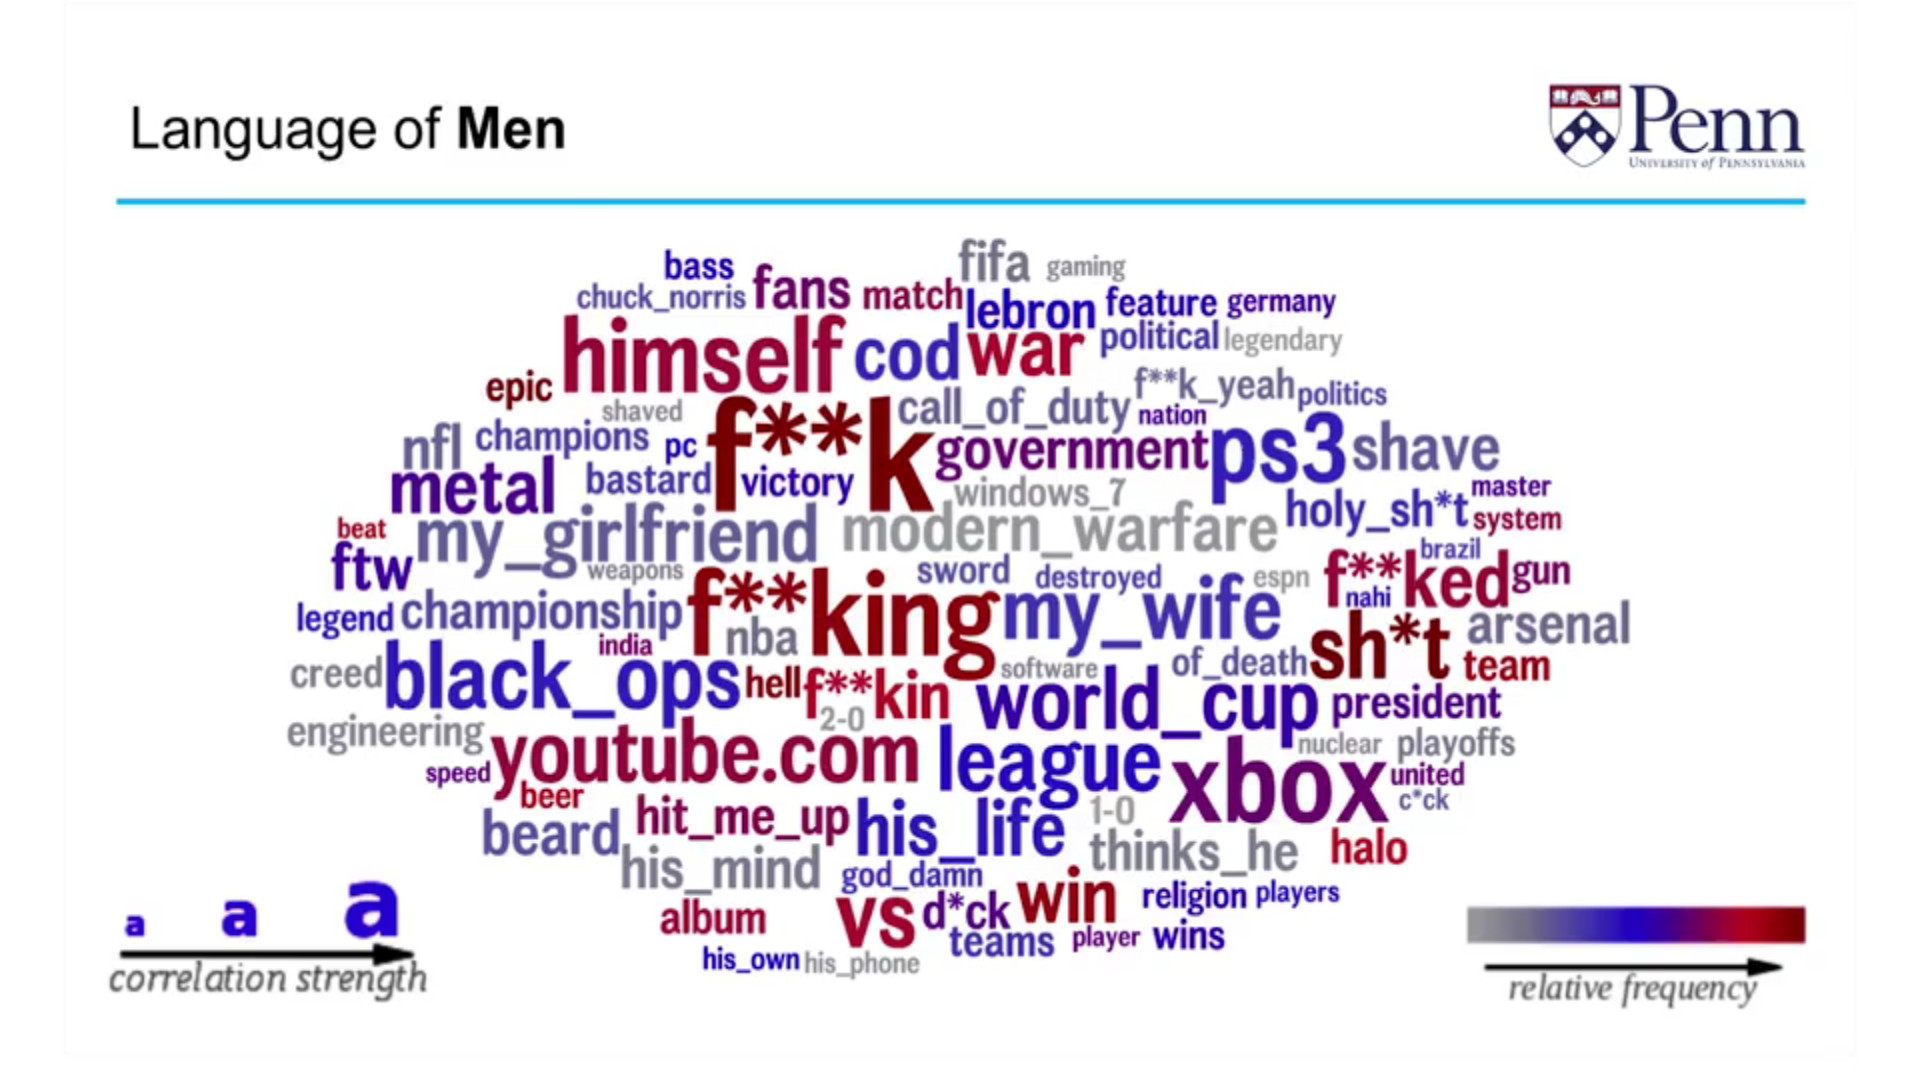
Compare this to the language of men. The first thing that jumps out at you is the curse words which show sings of “disagreeableness” and the tendency to break from social norms. It is also easy to see correlations to competition with words such as video games and sports. Also, words like “beard” and “shaving” are more indicative of being male than female.
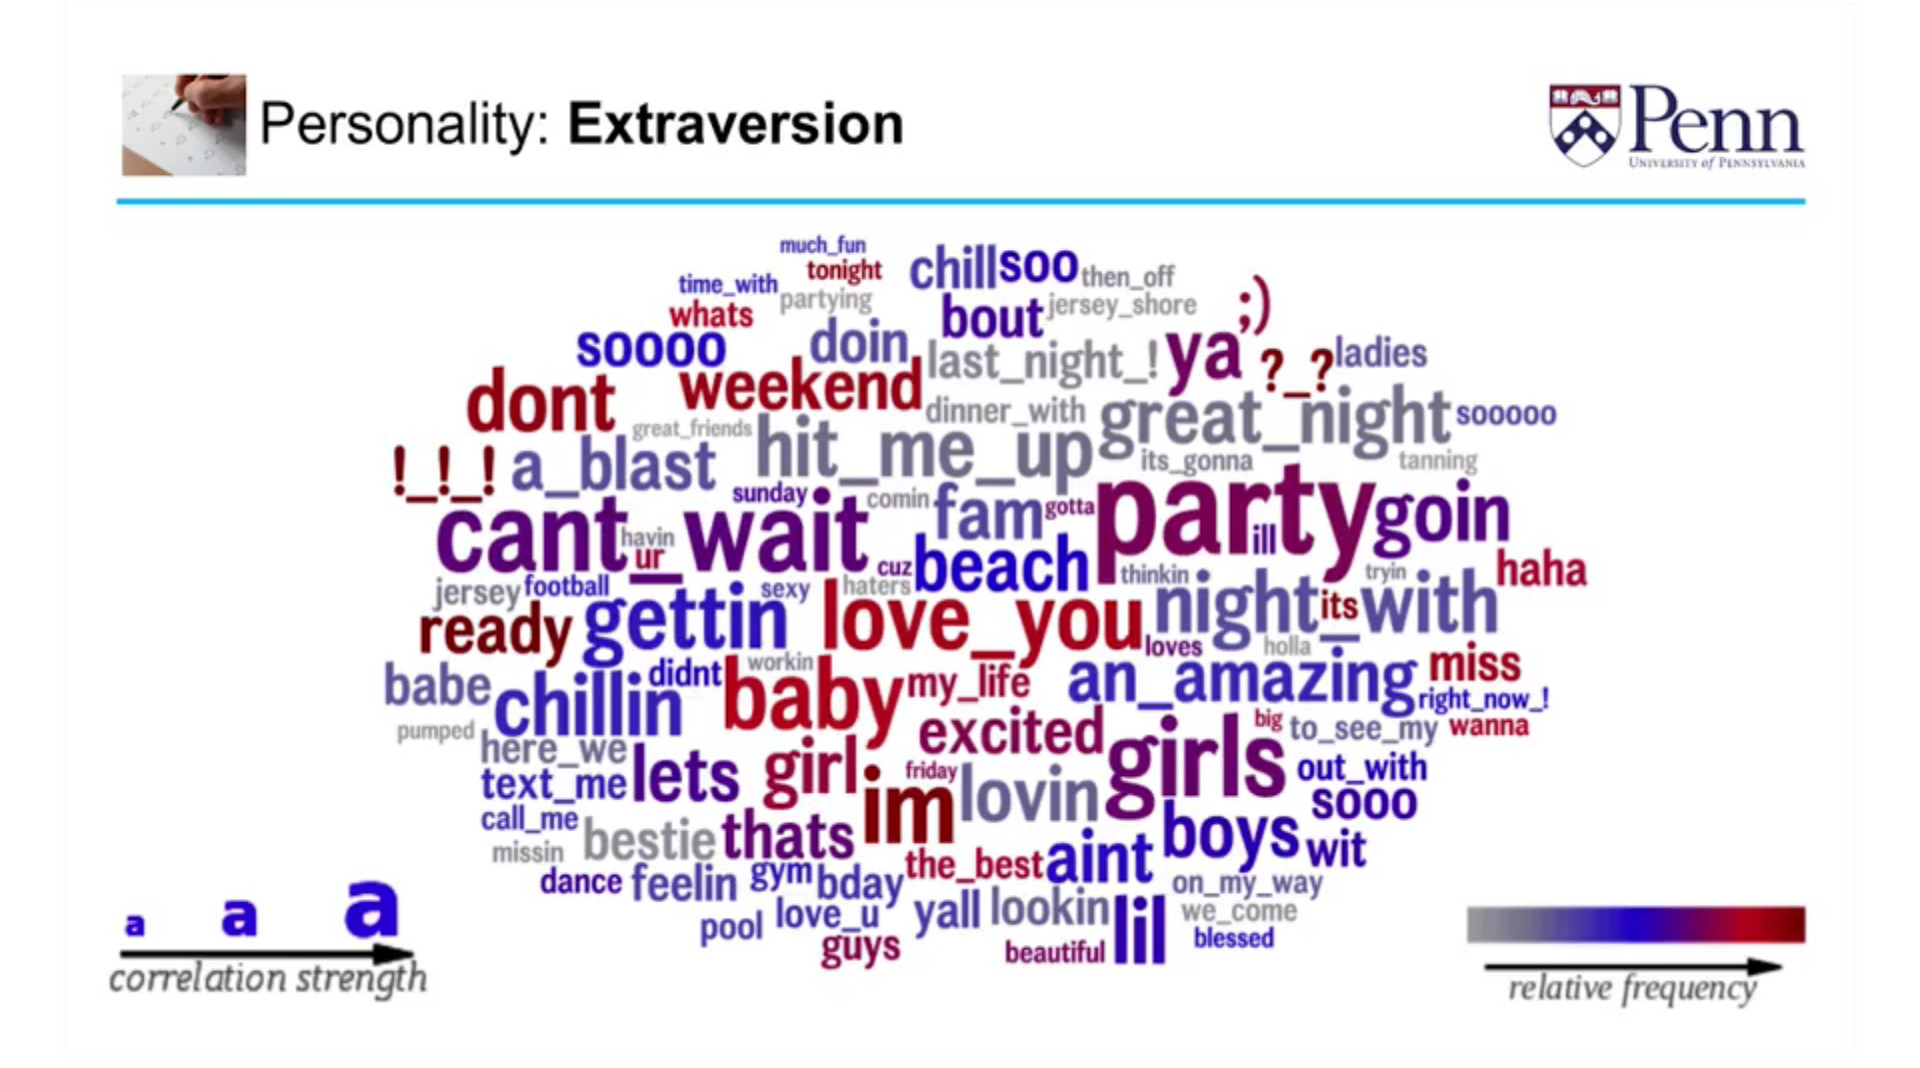
Here is the word cloud for extraversion. These are people who enjoy going out and spending time with other people. The single most predictive feature of being an extrovert is the word “party”. They also have a tendency to use a lot of “bigrams” or phrases with two words. Missing apostrophes is also indicative showing a general lack of impulse control and the need for immediate attention and reward seeking in social situations. They basically miss the apostrophe because they just simply can’t wait.
For introversion, on the other hand, you will see words such as “Pokemon” as being highly indicative of this personality trait. Words associated with seclusion and use of technology are also good indicators.
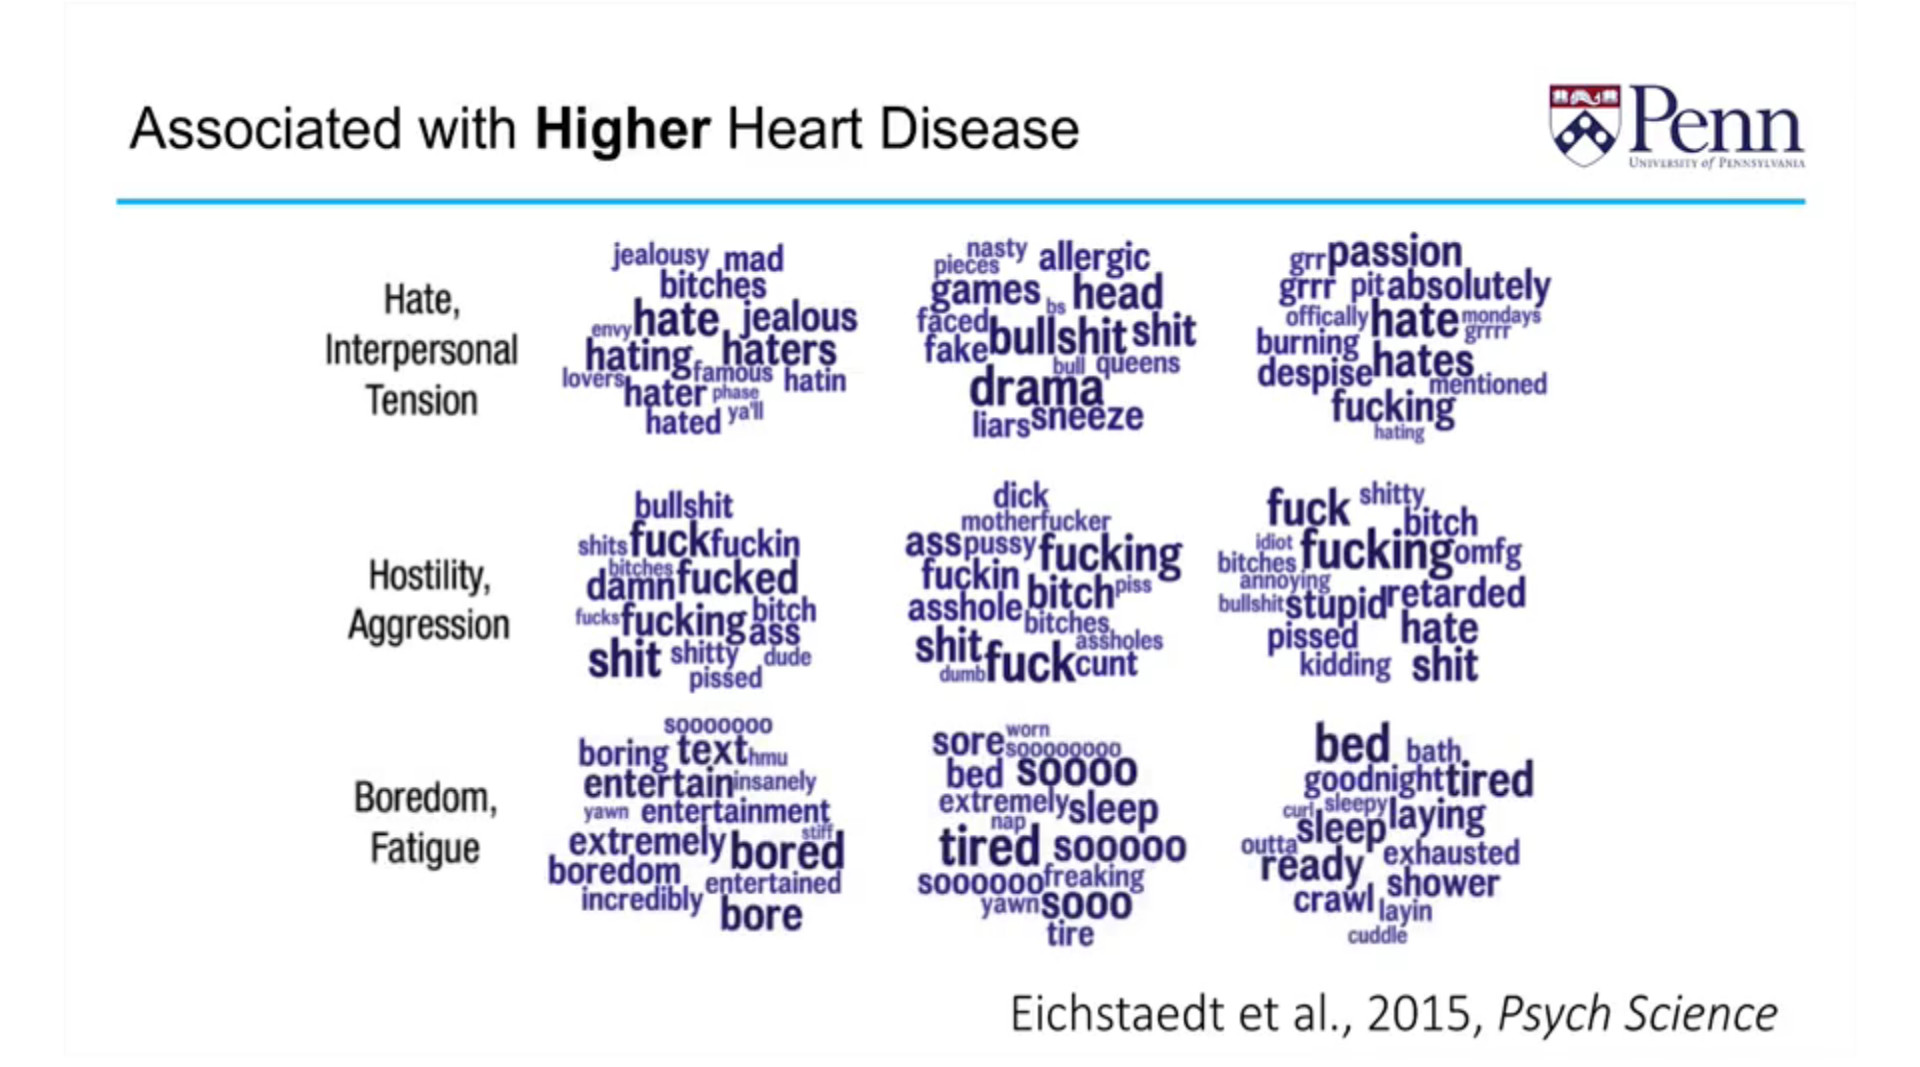
Another experiment these researchers did was analyzed a billion tweets and correlated them to their corresponding country. They retrieved heart disease data from the Centers for Disease Control in the US, correlated the data with the twitter words they had collected and then created a word cloud that represented individuals who had heart disease. You can see words like hate, hostility, aggression, cursing, disagreeableness, boredom and fatigue.
What’s interesting about all of this research is that the words or online “meta-tags” that we use in our day to day language can be very telling of who we are and the behaviors we will enact which will produce certain results in our lives. Just like all big data analytics, the power lies in the predictive nature of these tools and eventually the ability to create interventions to intercede and prevent.
At Impetus Digital, we are looking at ways to analyze the words, comments, and hidden online meta-tags that our clients’ advisors use in their asynchronous online assignments when participating in virtual advisory boards, steering committees, or working groups. By being able to ascertain which words correlate most with their advisors and then studying these over time, we hope to be able to show attitudinal and behavioral changes based on their personal biases, personalities, and knowledge sets. With this understanding, we also hope to be able to help our clients find the appropriate interventional points to influence and modify their customers’ perceptions, which will be correlated with new meta-tags.